Table of Contents
Lap View
Sub-Screens
You can access several sub-screens:
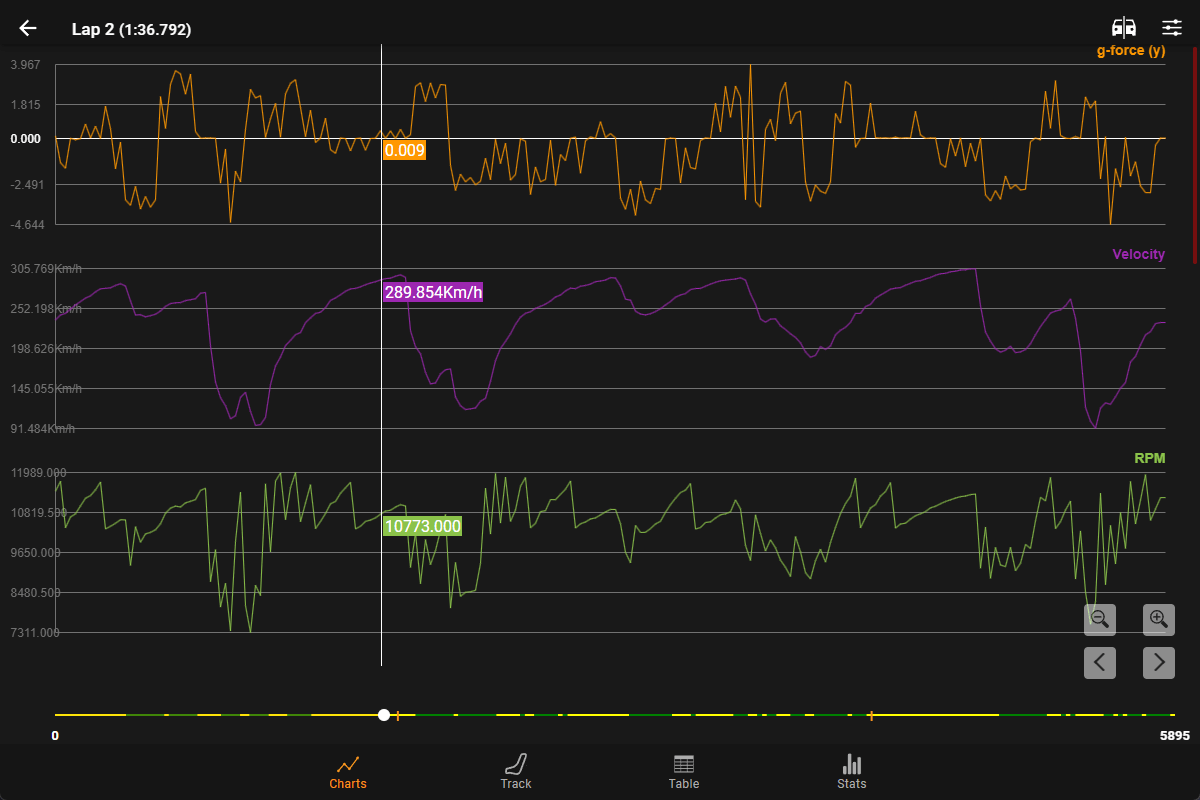
![]() Charts - customizable charts that displaying the recorded telemetry for the lap.
Charts - customizable charts that displaying the recorded telemetry for the lap.
![]() Track - a visualization of the recorded lap telemetry on a map of the track.
Track - a visualization of the recorded lap telemetry on a map of the track.
![]() Table - a table displaying the numerical recorded lap telemetry.
Table - a table displaying the numerical recorded lap telemetry.
![]() Stats - customizable numerical statistics of telemetry parameters.
Stats - customizable numerical statistics of telemetry parameters.
![]() Setup - the car setup for the recorded lap.
Setup - the car setup for the recorded lap.
Comparison Mode
![]() The Comparison Mode option allows you to load in telemetry data from a different recorded lap to compare against the current lap.
This mode is applied to all sub-screens.
The Comparison Mode option allows you to load in telemetry data from a different recorded lap to compare against the current lap.
This mode is applied to all sub-screens.
Position Slider
The position slider is available in the Lap Charts, Lap Track, and Lap Table sub-screens. It allows you to focus in on a particular point in the lap.
 It's position can be changed with a common slider at the bottom of the screens.
Alternatively, the forward and back buttons  can be used to make more precise adjustments to the slider position.
The position is synchronized across all the screens.
Green-Yellow sections
The “green-yellow” sections represent portions of the track where the lateral g-force is respectively above and below a predefined threshold: the corners are identified with the color green and the straights with the color yellow. It is used to help quickly identify the main corners of a circuit, by looking only at the Position Slider.
