User Tools
Table of Contents
Lap Charts
Chart Size Controls
 Maximize the chart to fill the screen.
 Hide the chart and minimize to a single row showing just the name and buttons.
 Restore back to the original size.
Chart Telemetry Configuration
The parameters displayed on the charts can be configured with the ![]() button at the top.
button at the top.
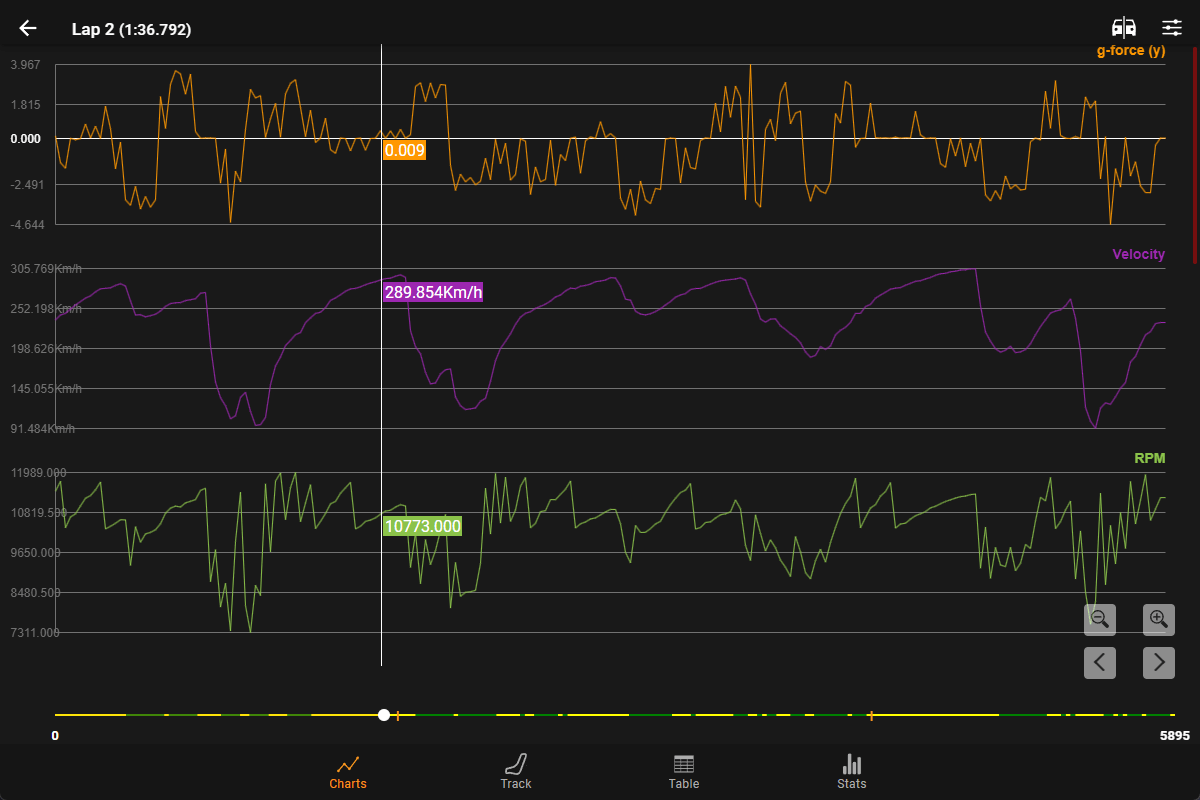
This will open a Parameter Selection screen showing a searchable list of parameters where you can configure the displayed charts.
Chart Navigation
The Position Slider location can be adjusted by dragging on the charts, with numerical telemetry values displayed for each chart at the slider location.
 The navigation buttons can also be used for fine control of the slider position.
 The zoom in and out buttons can be used to change the horizontal scale of the charts.
Comparison Mode
You can compare this lap against another recorded lap with the ![]() button at the top.
button at the top.
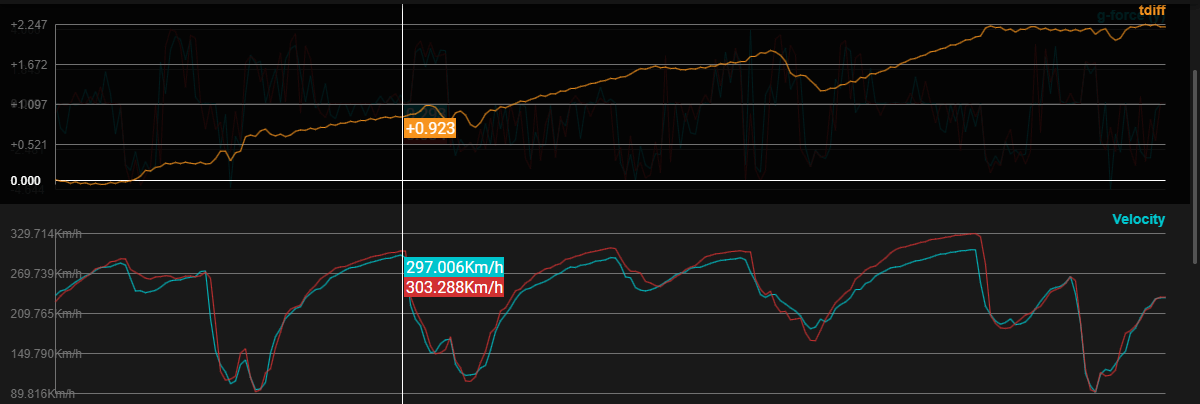
In Comparison Mode, telemetry data from both laps will be displayed on the charts.

Delta Time
Pinned to the top of the comparison charts is the Time Delta (TDiff) between the two laps. This can be used to identify parts of the lap where you were faster or slower providing an invaluable reference for maximising lap times.
Menu
![]() Open the Comparison Mode screen where you can select another recorded lap to compare against.
Open the Comparison Mode screen where you can select another recorded lap to compare against.
![]() Show the Parameter Selection screen where you can configure which telemetry parameters are displayed.
Show the Parameter Selection screen where you can configure which telemetry parameters are displayed.
Other Lap Screens
The other Lap View screens can be accessed using the buttons at the bottom of the screen.
![]() Track - a visualization of the recorded lap telemetry on a map of the track.
Track - a visualization of the recorded lap telemetry on a map of the track.
![]() Table - a table displaying the numerical recorded lap telemetry.
Table - a table displaying the numerical recorded lap telemetry.
![]() Stats - customizable numerical statistics of telemetry parameters.
Stats - customizable numerical statistics of telemetry parameters.
![]() Setup - the car setup for the recorded lap.
Setup - the car setup for the recorded lap.

