User Tools
Table of Contents
Session Charts
Session Information
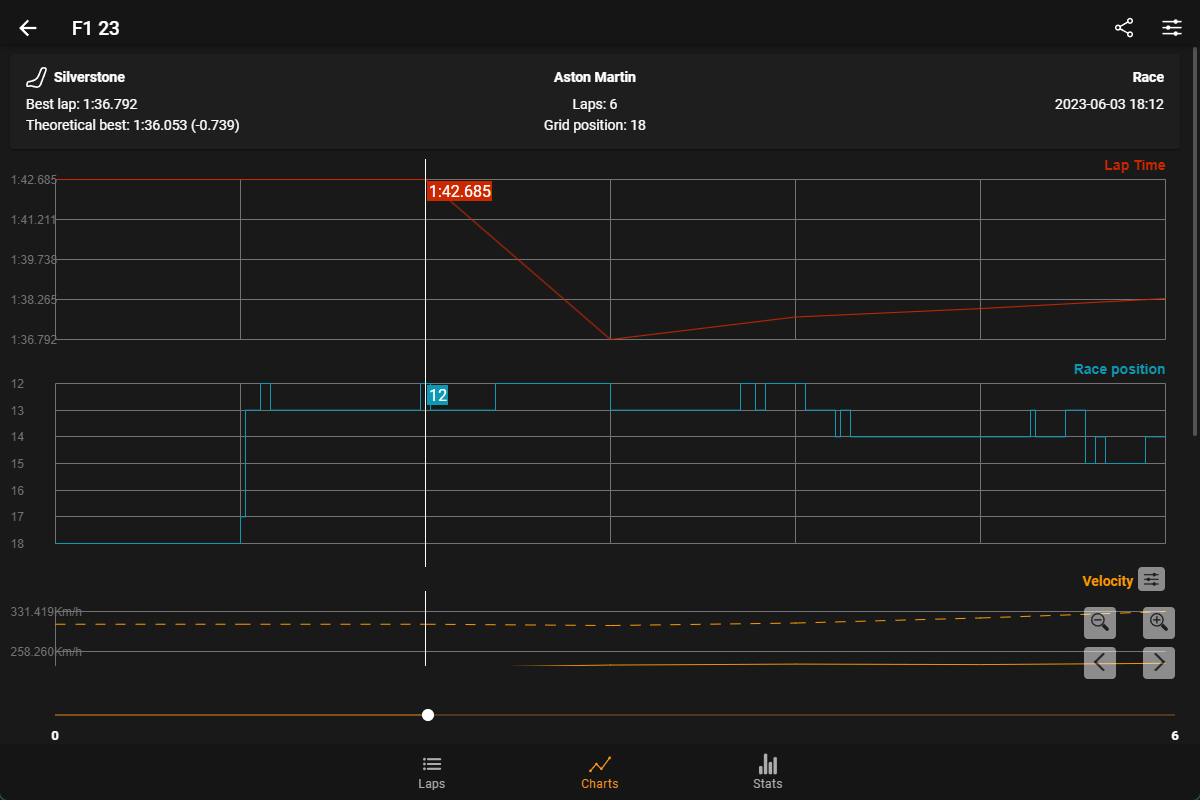
At the top of the page is some information about the recorded session including the track, vehicle, and session type (race, qualifying, etc.) It also displays the best lap time of the session along with a theoretical best lap time based on the fastest sector times.
Chart Key
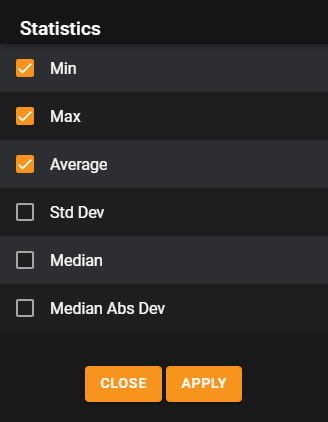
 Average
 Minimum / Maximum
 Standard Deviation
 Median
 Median Absolute Deviation
Chart Size Controls
 Maximize the chart to fill the screen.
 Hide the chart and minimize to a single row showing just the name and buttons.
 Restore back to the original size.
Chart Telemetry Configuration
The parameters displayed on the charts can be configured with the ![]() button at the top.
button at the top.
This will open a Stats Configuration screen showing a searchable list of parameters where you can configure the displayed stats.
Quick Stat Selection
The displayed stats on charts can also quickly be configured using the  button next to the chart name.
This will display a window where you can quickly toggle the displayed stats.

Chart Navigation
Using the slider bellow the charts you can step through the session data lap-by-lap, with numbers shown for each parameter displayed on the chart.
 The navigation buttons can also be used to adjust the slider position.
 The zoom in and out buttons can be used to change the horizontal scale of the charts.
Menu
![]() Export the session (as ''.SRT'' file or other formats).
Export the session (as ''.SRT'' file or other formats).
![]() Show the Stats Configuration screen where you can select which telemetry stats are displayed.
Show the Stats Configuration screen where you can select which telemetry stats are displayed.
Other Session Screens
The other Session View screens can be accessed using the buttons at the bottom of the screen.
![]() Laps - the complete list of recorded laps, selecting one lap you can access the detailed telemetry data (including charts, track views, the comparison mode and many other features).
Laps - the complete list of recorded laps, selecting one lap you can access the detailed telemetry data (including charts, track views, the comparison mode and many other features).
![]() Stats - customizable numerical statistics of telemetry parameters.
Stats - customizable numerical statistics of telemetry parameters.
![]() Setup - the car setup for the recorded session.
Setup - the car setup for the recorded session.

